![]()
|
Click on the graphics for larger version. For a printer friendly version, click here. |
|
I) Thinking like a Scientist A) Observing & Questioning 1) Note taking and remembering 2) Data a) Measurements and events 3) Leads to scientific thinking B) Hypothesis 1) A possible explanation to a scientific problem 2) Not always correct a) Stars motion from east to west first explained by the geocentric (earth-centered) model b) New questions lead to changes in original hypothesis 1) Copernicus suggested heliocentric (sun-centered) model of the solar system C) Testing a Hypothesis 1) Scientific test – testing a hypothesis a) Experimenting 1) A test designed to give data under controlled conditions b) Observing 1) Looking and recording data 2) Galileo proved Copernicus correct through observation c) Modeling 1) Usually cannot be used to prove as models are not the actual objects; but can suggest how things might actually look D) Reporting results 1) Papers 2) Experiments 3) Displays E) Development of Theories 1) A carefully built set of ideas that explains scientific observations 2) May develop over time a) Changes and Revisions 1) New evidence II) Tools of Earth Science A) Making measurements 1) Length a) Meter 1) Meter stick 2) Volume a) Liter 1) Graduated cylinder 2) Beaker 3) Mass a) Gram 1) Triple beam balance 4) Temperature a) Degree Celsius 1) 0º - water freezes 2) 100º - water boils b) Kelvin 1) Absolute 0 i) No presence of molecular activity ii) About -273º Celsius iii) 0K - read as "Zero Kelvin" c) Rankine 1) Absolute 0 i) No presence of molecular activity ii) Used by engineers 5) Other tools a) Books b) Graphs c) Photos III) Maps in Earth Science A) Locating places 1) Latitude lines a) Equator (0º) 1) Line circling the earth halfway between the north and south poles b) Labeled in degrees c) Locations north and south of equator 2) Longitude lines a) Prime Meridian (0º) 1) Line drawn from pole to pole through Greenwich, England i) Original site of the Royal Greenwich Observatory 2) Labeled in degrees b) Locations east and west of the prime meridian 3) Map scale a) Compares distances on the map with distances on the earth 4) Legend a) Listing of symbols used on a map 5) Height above sea level a) Bench mark 1) A point whose position and elevation have been marked accurately (usually labeled with an “X”) b) Contour line 1) Connects places on a map all at same elevation 2) Contour interval i) Difference in elevation between contour lines B) Maps 1) Types of maps a) Highway map 1) Shows roads, major points of interest, cities, etc. b) Topographic map 1) Shapes and features of earth’s surface 2) Elevation c) Weather maps 1) Isobars i) Contour lines that show air pressure d) Star maps 1) Location of stars and other objects in space |
The Scientific Method |
|
|
Scientific Instruments |
||
 Ruler |
Erlenmeyer flask |
|
|
Beaker |
Graduated Cylinder |
|
|
Volumetric Flask |
Pipets
|
|
|
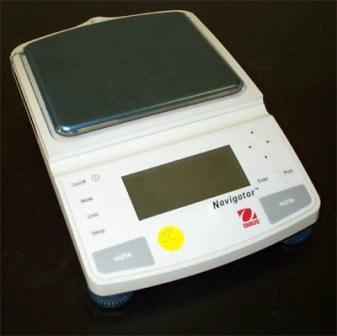
Analytical Balance |
Top-loading Balance |
|
|
Galileo Thermometer |
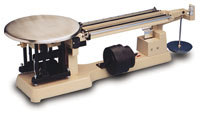
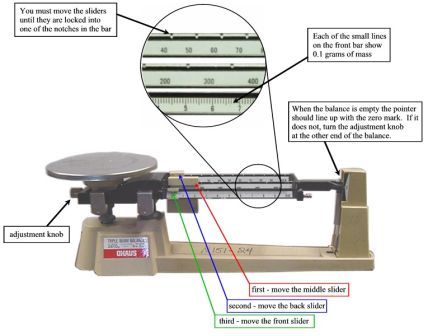
Triple Beam Balance
|
|
|
Topographic Map |
||
|
Latitude and Longitude |
||
|
World Atlas |
||
|
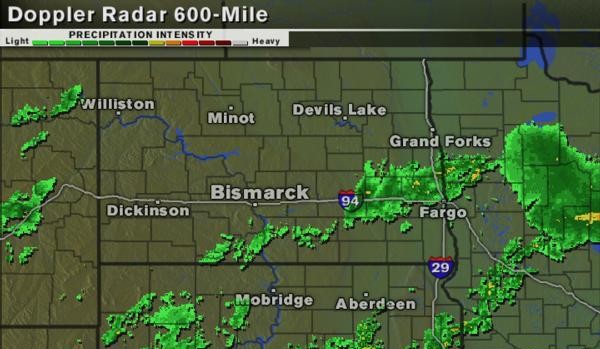
Weather Map |
||
|
Star Map/Chart |
||
![]()